MODERATOR:
Julie Vo
Senior Editorial Coordinator
American Society for Clinical Pharmacology & Therapeutics
Alexandria, Virginia
SPEAKERS:
Christine Melchione Adams
Publications Coordinator
American Society of Clinical Oncology (ASCO)
Alexandria, Virginia
Jason Roberts
Senior Partner
Origin Editorial
Ottawa, Ontario, Canada
Morgan Sorenson
Managing Editor
Neurology: Neuroimmunology & Neuroinflamation
American Academy of Neurology
Minneapolis, Minnesota
REPORTER:
Meghan McDevitt
Managing Editor
The Journal of Pediatrics
Cincinnati Children’s Hospital Medical Center
Cincinnati, Ohio
Editorial offices are often asked to provide reports, perhaps annually for an editorial board meeting or ad hoc when requested by an editor. But are these reports being used effectively to influence better editorial decisions? This practical session on editorial office reporting provided attendees with an overview of reporting practices, pitfalls and how to avoid them, and case‐based examples.
Jason Roberts, Senior Partner at Origin Editorial, began by discussing the many reasons reports are run and used, such as to monitor progress, set benchmarks, or to anticipate or plan for future developments. However, running a report, obtaining the data required, and analyzing it is not always simple. Many problems exist in editorial office reporting including placing too much meaning on too few data points, overusing a solitary average (rather than a mean and range), and ignoring confounders when interpreting the data. Additionally, a lack of industry standards makes it impossible to compare data across journals. Many editorial offices also experience a lack of continuity between the reports run year-to-year, and thus have no historical context for the data they’re trying to interpret. Roberts recommended making sure that the report methodology is recorded in detail so that it can be repeated in the future. This ensures that the same information is being compared each time and provides continuity.
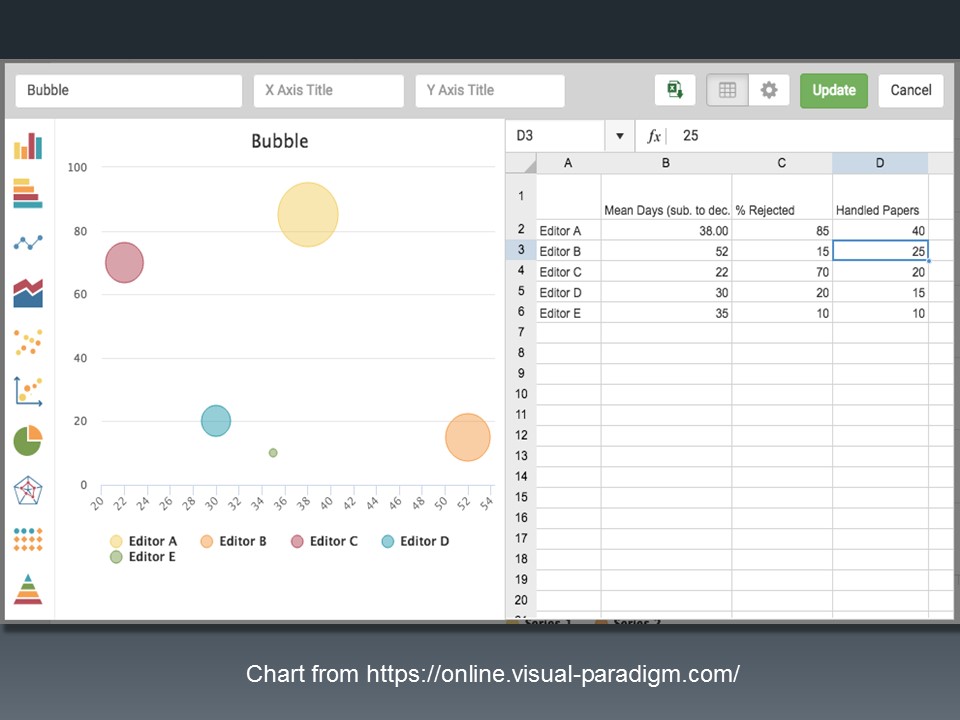
It is also important to make sure that data are presented clearly and that the correct type of visual representation of the data is used. Visual presentation of the data can help simplify complex messages. For instance, a graphic such as a box plot (alternatively a box and whisker plot) can show the spread of data around a median much more clearly than a number such as a mean with standard deviation or median with the interquartile range (especially for those of us that find statistics challenging). Sometimes the correct chart can reveal patterns otherwise hidden in a table. A scatterplot might usefully reveal, for example, which editors are hitting targets for manuscripts handled and associated rejection rates.
Managing Editor Morgan Sorenson explained how at Neurology, a rejected article tracker was developed to examine the fate of rejected manuscripts submitted to the journal. Because 75% of submissions are rejected, and this rate had been increasing, they wanted to learn if these rejected manuscripts eventually are published in other journals, especially in ones of which they were not aware. Data from the rejected article tracker allowed them to examine which topics were being rejected and then eventually accepted (and cited) elsewhere, which provided feedback for the editors who might wonder if they were rejecting good papers. Additionally, they can use the report to better evaluate papers that could be resubmitted to their spoke journal.
Sorenson mentioned several caveats about this report. Even if a “good” paper was rejected, the field may be saturated with specialty journals in that topic area. The rejected papers might not have been within the scope of the journal, and thus were not a good fit. Additionally, not all rejected papers could be found through the report for a variety of reasons, such as maybe the paper was never published or the article’s title changed drastically.
Christine Melchione Adams, Publications Coordinator at the American Society of Clinical Oncology (ASCO), presented attendees with a challenge most journals encounter: How to ensure equal distribution of responsibilities among editorial board members? Although they were aware of the problem, as well as some of the causes, the team wanted to find a way to measure and track this issue in the hope of finding a “Goldilocks solution.”
They developed the EBM Utilization Report to track editorial board members’ activity in order to determine which board members were being underutilized as reviewers. For their journal, the goal was for each editorial board member to complete three reviews per year. However, associate editors were more likely to select those members who had served for a longer time on the board and new editorial board members were not gaining experience as reviewers.
Prior to the development of the report, Adams reported that 47% of editorial board members were being underutilized. Their goal was to decrease this by 10%. The report collected reviewer data from the editorial system and they were able to sort each editorial board member into one of three categories: underutilized (<3 reviews completed), on target (2–4 reviews completed), and overutilized (>4 reviews completed). By tracking this data and sharing it with the associate editors, they were able to decrease the number of editorial board members who were being underutilized to 35%. Although they met their goal, Adams mentioned that one‐third of their editorial board members are still being underutilized so more work is needed to continue to decrease disparities and create a balance among editorial board members’ responsibilities.
This session was particularly useful to managing editors or other editorial office staff who run regular reports. Journals should strive to make better, informed policies and protocols based on actual data, rather than anecdotal observations, and editorial offices can use the information covered in this session to take practical next steps.