MODERATOR:
Carissa Gilman
Managing Editor
CANCER, American Cancer Society
Atlanta, Georgia
SPEAKERS:
Dr Mary Dott
Online Editor
Morbidity and Mortality Weekly Report, Centers for Disease Control and Prevention
Atlanta, Georgia
Andrew Smith
Production Operations Manager
Cell Press
Cambridge, Massachusetts
REPORTER:
Jamie Scott
The JAMA Network
Chicago, Illinois
Scientific publishers continuously face the challenge of how to produce clear and accessible research for their audiences. In an ever-advancing technological world, the challenge has extended to how to distill that research into concise portions for social media and busy audiences, who increasingly search for information on mobile phones and tablets, and usually while time is of great importance. A growing answer to this problem is graphical and visual abstracts: easy-to-digest pictorial summaries of an article’s key points.
Moderator Carissa Gilman gave a brief introduction to the topic by explaining that the terms graphical abstract and visual abstract are often used interchangeably because there are no universally accepted definitions for the two. However, she described their differences in that graphical abstracts typically contain one panel that gives a brief snapshot of the article, while visual abstracts contain a more detailed three-panel display of key questions, interventions, and outcomes. Both approaches have the benefit of helping researchers identify and share what is relevant to their research. Gilman also stressed that these abstracts should be seen as a preview to an article, not a substitute. The tricky part is getting a message across, especially regarding who it is for and what kind of study it is from, in limited words.
Andrew Smith then shared the successful integration of graphical abstracts into the publishing process at Cell Press (Figure 1) in a presentation titled “Graphical Abstracts: From the Future to Today.”
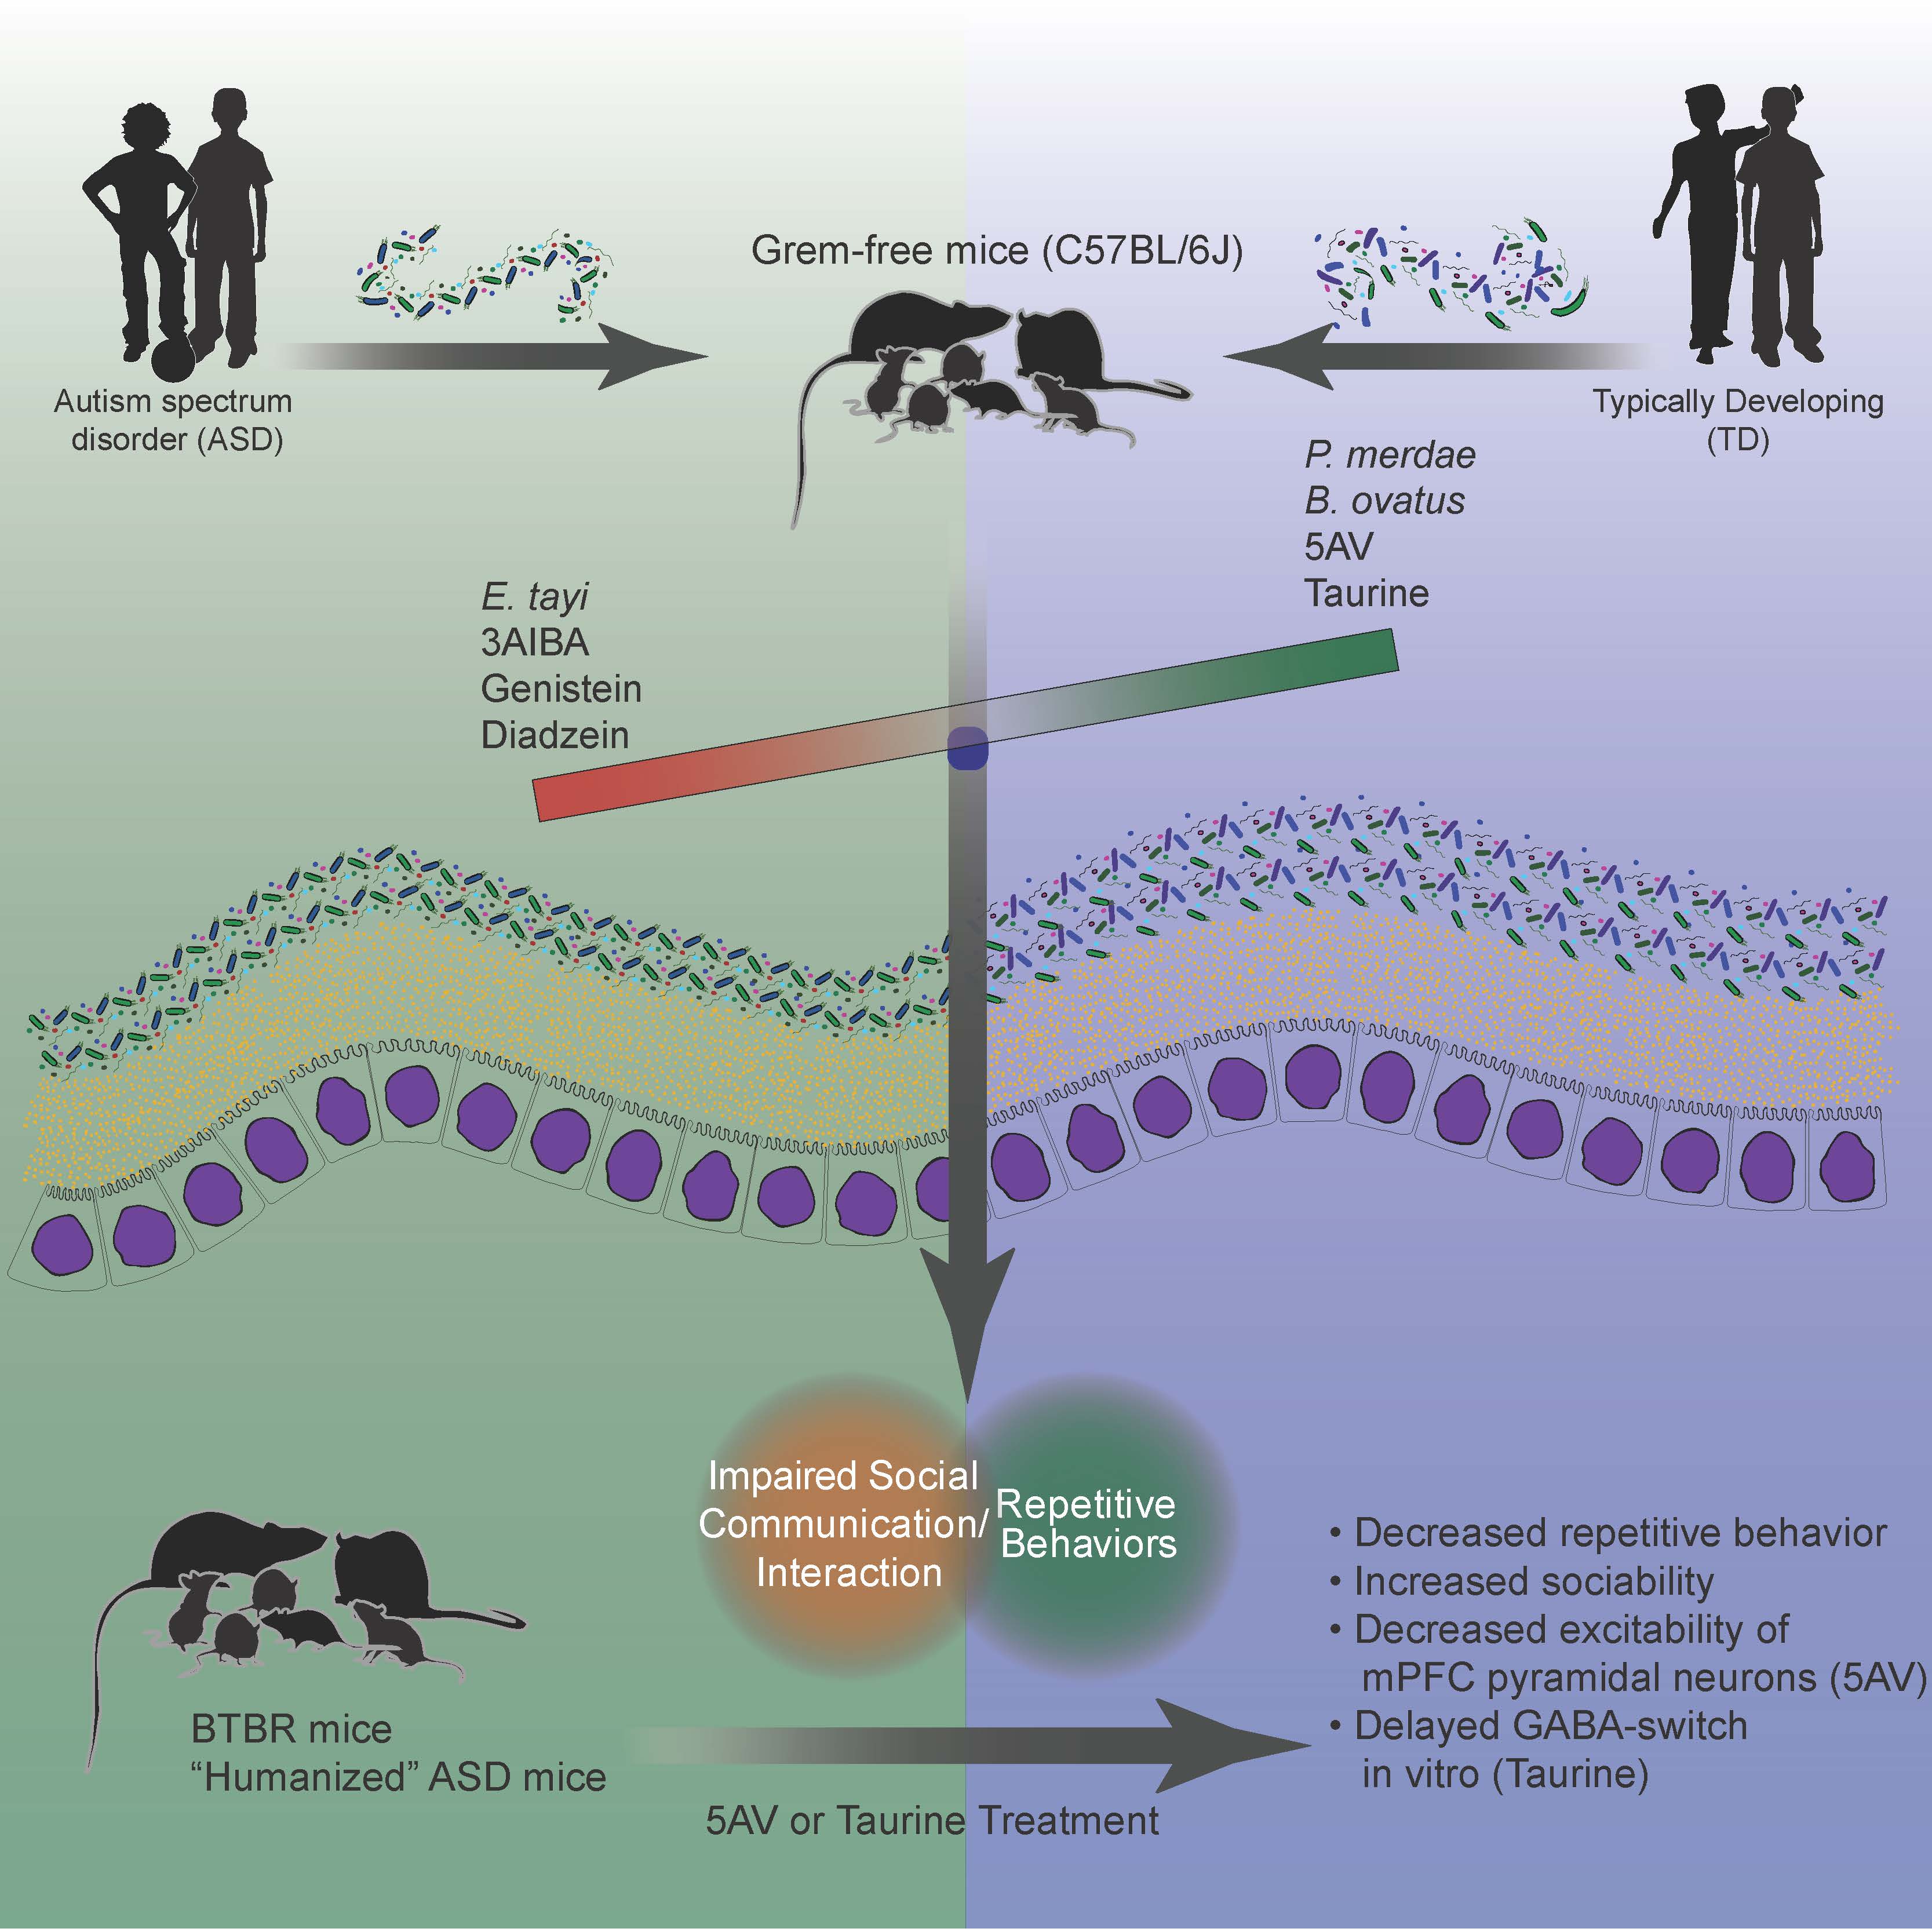
Two years after launching graphical abstracts, Smith said that Cell Press had garnered enough experience to create guidelines for the abstracts,2 including (1) have a clear beginning and end, (2) provide visual indication of the biological context and results, (3) be distinct from any figures or diagrams in the article, (4) emphasize new findings without including excess detail from previous literature, (5) avoid the inclusion of features that are more speculative, and (6) do not include data items of any type (all content should be in the graphical form).
The lessons learned while perfecting this process include keeping the product simple without losing its innovation and that authors will do the work of creating the graphical abstract if they know it will add value to their articles and if instructions are clear (“2 big ifs,” Smith warned, though establishing guidelines help). The reward, however, is an excellent visual, which always helps to draw in more readers, Smith said. There is additional “bang for the buck” because the visual can be scaled and reused for multiple platforms, including social media, websites, and presentations.
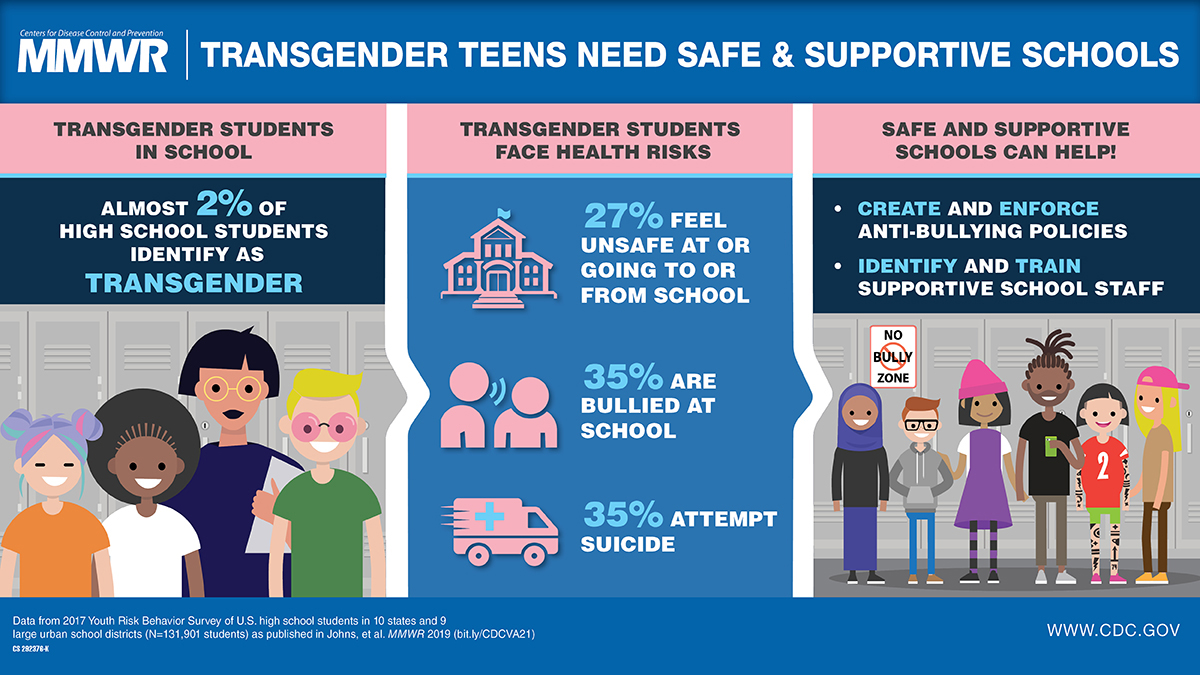
The second presenter, Dr Mary Dott, described the use of visual abstracts at the Centers for Disease Control and Prevention’s Morbidity and Mortality Weekly Report (MMWR) (Figure 2). “Because communication is changing rapidly, with new obstacles to reach audiences, publishers really have to think about creating compelling materials that will attract attention,” she said.
The best way to do this is to tell a story through the abstract in order to invoke emotion with intention and create meaningful calls to action. Paraphrasing the founder of visual abstracts, Dr Andrew Ibrahim,3 Dott outlines how to do this through the following steps: (1) focus on the user experience, (2) narrow down the key messages, (3) prototype quickly to find what works, (4) solicit feedback and study other designs, (5) prioritize key messages over completeness, and (6) balance your design creatively with thoughtful restraint and clarity of purpose.
In MMWR’s first attempts to publish visual abstracts, Dott said that they tried to adhere to a 1-week timeframe, in line with their publishing schedule. However, they found that it was difficult to do a quality job in that short amount of time. After a few attempts, they settled into a formula for their three-panel visual abstracts: (1) the main message on risk, (2) the report’s data trend/results, and (3) the actionable public health message. Dott also said that using fewer words, and using action words directed at a specific population, has worked best for them. MMWR now uses a 3-week timeline with multiple rounds of review through editors and graphics to complete its visual abstracts.
During a question-and-answer period following the presentations, audience members expressed gratitude to the presenters for sharing their experiences establishing successful production of graphical and visual abstracts. For many, it is seen as a daunting task. Gilman ended the session by emphasizing what Smith and Dott discussed: It is important to be open to taking different approaches to using visuals, particularly while establishing your process, and to find what works for your organization.
References and Links
- Sharon G, Cruz NJ, Kang DW, Gandal MJ, Wang B, Kim YM, Zink EM, Casey CP, Taylor BC, Lane CJ, et al. Human gut microbiota from autism spectrum disorder promote behavioral symptoms in mice. Cell. 2019;177(6):P1600.E17–P1618.E17. https://doi.org/10.1016/j.cell.2019.05.004.
- Cell Press. Cell Press graphical abstract guidelines. [accessed December 16, 2019]. https://www.cell.com/pb/assets/raw/shared/figureguidelines/GA_guide.pdf.
- Ibrahim AM. Use of a visual abstract to disseminate scientific research. [accessed December 16, 2019]. https://static1.squarespace.com/static/5854aaa044024321a353bb0d/t/5a527aa89140b76bbfb2028a/1515354827682/VisualAbstract_Primer_v4_1.pdf.