SPEAKER:
Jessica Malaty Rivera
Science Communication Lead for the COVID Tracking Project
REPORTER:
El-shama Q.A Nwoko
African Journal of Laboratory Medicine
Plenary speaker Jessica Malaty Rivera is an Infectious Disease Epidemiologist and Science Communicator with 15 years of experience in disease surveillance research, public policy, and vaccine advocacy. She began her presentation by giving a background of her education and experience, then went on to share some best practices she has picked up through the years, which were implemented in the COVID Tracking Project. She concluded by sharing the aim, language, and science of science communication.
Background
Malaty Rivera received her Master of Science degree in Emerging and Infectious Diseases from Georgetown University 10 years ago. After that time, she worked at the now defunded Division of Integrated Biodefence at Georgetown. The Division focused on biosurveillance, serving as an “infectious disease Weather Channel” that identified indicators and warnings of emerging animal and human epidemics and pandemics. The Division translated information from over 50 different languages into reports and algorithms for predicting the severity of impending outbreaks. Using this approach, the Division detected the 2009 H1N1 Pandemic. This experience, Malaty Rivera says, prepared her for her role as a science communicator. Sadly, she noted that the Division could not detect the COVID-19 pandemic because it was devalued and ultimately defunded. She reemphasized the role of biosurveillance in pandemic preparedness and stated its current lacking hugely contributed to the COVID-19 pandemic unpreparedness as there would have been some warning indicators in late 2019.
Science Communication Best Practices
The COVID Tracking Project was started by journalists seeking a uniform place to obtain data (hospitalization and testing data) that at the time did not exist. They collected data from all 56 U.S. states and territories. However, because there were no federal standards for reporting or writing information related to COVID-19, this led to patchwork communication; this was when Malaty Rivera joined the project as the science communication lead.
The COVID Tracking Project collected and published the most complete COVID data from state, territorial, and federal dashboards for 365 days (March 7, 2020–March 7, 2021). Data collected consisted of testing, hospitalization, and health outcomes data as well as race and ethnicity and long-term care COVID data. Malaty Rivera shared some science communication best practices implemented in the COVID Tracking Project.
Data Source
She emphasized the importance of authentic data sources. Buttressing this, she explained that the COVID Tracker data were obtained from official sources: public, state, and territorial.
Data Presentation
Data should be appropriately curated, annotated with definitions, and caveated. According to her, the COVID Tracking data were manually curated to avoid the “perils of automation.” Thus, the data could be said to be extremely accurate. Also, all data presented had annotations, the definition of nuances, and caveats for anomalies. To achieve this, the COVID Tracking project had teams dedicated to annotations, the definition of terms, and the explanation of anomalies.
Reporting Priorities
Science communication should be accessible and reproducible. The COVID Tracking reports were fully accessible, mostly text-based, and written in simple English to improve readability. Also, the performance of the website was lean for low-end devices and internet connectivity. And most importantly, the team aimed for transparency. Disclaimers were always included whenever necessary; data were downloadable as .csv files and were not behind a paywall.
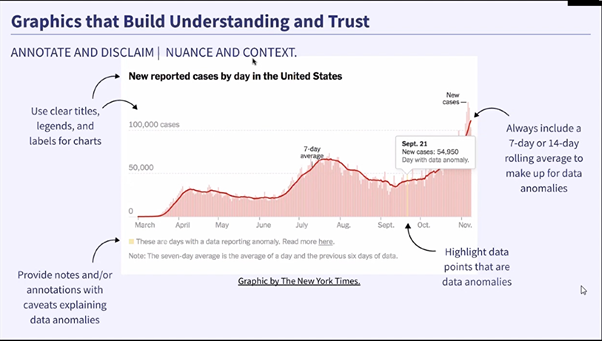
Data Reporting Habits
When reporting data, it is good practice to be cautious. The team did not presume to be a public health authority but strived to build understanding and trust. To further this goal, the graphs were rich with annotations and disclaimers (Figure).
Training the Audience to Understand Data and Avoid Misinterpretations
Malaty Rivera noted the relevance of training the public to understand the data as well as how best to look at data to avoid misunderstanding. She summarized the steps with the 6points below:
- Understand dating schemes: The COVID Tracking Project always explained in their tweets and blogs that today’s cases were people exposed a week or two ago and often pointed readers to rolling week averages. Also, they had caveats for data lags to avoid a misunderstanding of a surge. This trained their readers to look deeper into the data to determine if the data was current or historical.
- Study data definitions: Malaty Rivera advised that when presenting data, it is important to include metric definitions. This, she said, will aid understanding and interpretation of each metric and ensure ‘same metric’ comparisons. For instance, the “test positivity” metric is influenced by varying factors, and the inclusion of these factors varied across the states. Hence, the ban of movement between states based on varying definitions of “test positivity” was one bad take on data based on a poor understanding of data metrics.
- Look for confounding factors.
- Use established relationships between metrics to guide interpretation: The logical fallacy of correlation and causation is a trap many fall into when dealing with limited characters for posting tweets/headlines. You get more tweets when you put two strong headings together but this can lead to a logical fallacy, which requires more research and convincing to clear up and correct.
- Be conservative about what can be known: It is acceptable to say “we do not know” or “data has not proven it yet” instead of making quick conclusions, predictions, or prescriptions.
- Be faithful, not tactical: Be predictable and reliable, e.g., providing data daily without fail and erring on the side of caution.
- Science communication: Aim, language, and science.
In conclusion, Malaty Rivera explained the languages required for fluency in science communication and the science of science communication. These languages include those of scientists, nonscientists, and pseudoscientists. She also emphasized the importance of emotional intelligence, which requires empathy and cultural competence, particularly in the vaccine space. While the ethos for vaccine advocacy is great, making the vaccine stance binary is not because it devalues legitimate reasons for vaccine hesitancy, such as medical trauma. Empathy and repetition are necessary for combating misinformation.
Malaty Rivera emphasised that the goals of science communication are to increase science literacy, improve data comprehension, debunk misinformation and disinformation, demystify science and research and prevent (or “pre-bunk”) logical fallacies. Thus, it is important to know when to say “I do not know,” to seek consensus and reproducibility, to remember the “science” audience is not monolithic, and to collaborate with other experts.
Malaty Rivera concluded by saying that, “if science is not communicated in the correct language, it is either going to harm or not be helpful at all.”