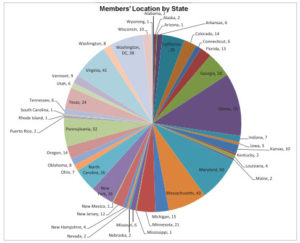
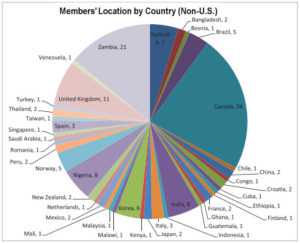
 Every once in a while it’s a good idea to take a look at the state of your organization, and if you are part of a scholarly society, evaluate your membership demographics. In the interest of sharing such details about our own CSE membership, please enjoy some pie charts depicting various demographics. One interesting tidbit to note is that although 80% of our members live in the United States, we have members from 41 different countries!
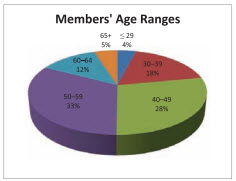 The data for the Members’ Age Ranges, Members’ Primary Fields of Publication, and Members’ Primary Roles charts are taken from the member registration questionnaire, but are not required fields, so these numbers are only representative of those who submitted the data. As you can see, it is important for us to collect these data so that we know to whom we should cater our educational opportunities such as webinars and annual meeting short courses and sessions.
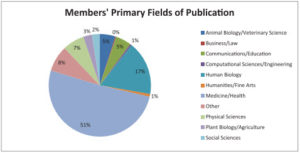 For example, we have more members in the medicine and health journal field (51%) than all other fields combined, but we don’t want to leave out any other fields when considering topics for meeting sessions. We also don’t want to create a lineup of webinars specifically tailored to the needs of manuscript editors or managing editors because our members inhabit such a wide range of roles.
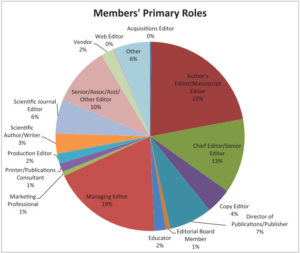 It’s also important to consider that many of our members who are senior, associate, and chief editors are likely practitioners within their fields and may be less familiar with the nuts and bolts of proofreading and style sheets or the overall publication process. In some cases, they may be interested in learning more about those areas, or if they are new to their role, they may want to learn more about how to perform their assigned duties and figure out how they fit into the bigger picture. We want to be able to take all of these factors into consideration so that we know how best to serve you, our members. So when we send out questionnaires or ask for this type of information on registration forms, even though it may not be required, please consider filling them out so that we can gather and analyze the data, continue to grown, and be the best organization for professionals in the scholarly publishing industry that we can be.