Abstract
It is critical for researchers and grantees alike to adhere to rigor and transparency criteria to ensure their contributions to scientific research are sufficiently transparent so they can be replicated and eventually reproduced. SciScore evaluates scientific manuscripts for compliance with consensus granting agency and journal recommendations designed to address different aspects of rigor and transparency in the published literature (e.g., MDAR [Materials Design Analysis Reporting], ARRIVE [Animal Research: Reporting In Vivo Experiments], CONSORT [Consolidated Standards of Reporting Trials], RRID [Research Resource Identification] standards). SciScore has been implemented by several society publishers in different ways, with one allowing authors to run the tool as often as they wish, and another having editors verify manuscripts using the report provided by the tool. Results show that the use of the tool led to an increase in the average SciScore over time or via the revision process. The use of the tool also resulted in an increase in the number of manuscripts with RRIDs, a fairly easy transparency criterion to check. We conclude that the use of the tool is effective in improving some aspects of rigor of research articles.
Introduction
Rigor and transparency criteria for the biological sciences are now well-defined by funders,1 publishers,2 and meta-researchers.3 All essentially agree on several key aspects of the study that are consistent with higher levels of replicability of a study. These recommendations have been common practice in clinical studies for decades but have been infrequently used in the preclinical literature.3 These key aspects of the study include the authors addressing the following: blinding of investigators or subjects with regard to group membership, randomizing subjects into groups, determining group size based on the power calculation, adding a detailed description of subject selection criteria as well as attrition, and of course, treating sex of subjects as an important biological variable. In preclinical studies, unambiguous identification of key resources such as mice and reagents such as antibodies is accomplished by the use of Research Resource Identifiers (RRIDs4). RRIDs are persistent identifiers for key resources (antibodies, model organisms, and software projects) assigned to help researchers cite these in the biomedical literature to improve the transparency of research methods.5 In addition, the deposition and validation of data and code into appropriate repositories and the use of protocol databases or protocol journals are all aspects of manuscripts that are associated with better quality.6–8
To improve scientific reproducibility within their articles, multiple publishers have put forward new editorial policies and guidelines for authors. The most visible case is perhaps Nature, which implemented a checklist that all authors must address. Over 1000 journals now ask that authors identify key resources by using the RRID, resulting in 500,000+ RRIDs being used in scholarly literature by 2022.9 Various society publishers have implemented checklists and processes that require many of these rigor-related items to be addressed. All of these are laudable steps toward more reproducible scientific literature; however, these are not cost-free endeavors because enforcement of any of these can be significant, especially as they involve staff time.
SciScore10,11 is a methods review tool for scientific articles that can check for most of the common rigor criteria, data deposition, and RRIDs in an automated way (Figure 1). The tool can be used as a standalone, such that editors or authors run methods sections through our tool to assess their adherence to common rigor and reproducibility guidelines. It can also be integrated in a journal submission platform such as eJournalPress or Editorial Manager, where it is used by a number of publishers. While integrated, it will cost little to no staff time to run because submitting authors paste relevant sections of their paper into a tool without leaving the submission platform.
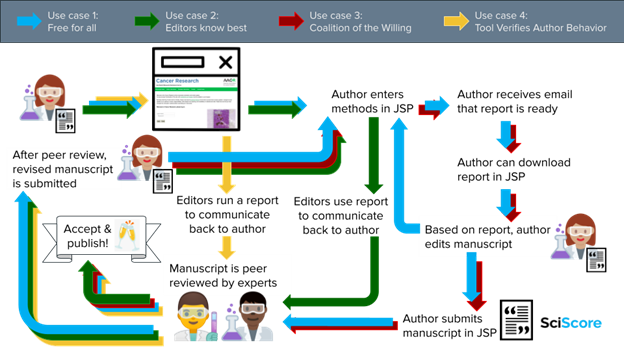
The tool has been used for over a year at several society publishers, and we now examine what sorts of conclusions can be drawn from the past year of work. We will examine several use cases in how the tool was implemented and examine how this process impacts the behavior of authors. Although the publishers involved in this study may well be tracked down, we choose to use the method of implementation instead of the names of the participants. These methods of implementation of SciScore should be transposable to any publishers that would like to use them.
Methods and Results
To analyze the effectiveness of our tool in the various journal submission workflows, we downloaded the scores from the SciScore database. Each of the use cases represents the data of 1 publisher with multiple journals. Data were further analyzed in Google Sheets, where it was split out into original submissions and revisions. We were grateful to receive 200 original submissions and matched revisions from a publisher not working with us for our control. For these experiments (see Figures 7 and 8), we also used 200 original submissions and matched revisions from 2 journals from use case 1 and 2.
Use Case 1: “Free for All”
The publisher allowed authors to access the SciScore tool as frequently as the authors desired during submission and all subsequent revisions prior to manuscript acceptance. The tool must be run at least once at each step but may be run by authors multiple times at any step. Authors, editors, and reviewers had access to the reports. There was no special mention to reviewers that they should or should not review the report. Under 1 year into the use of the service, the publisher updated the SciScore submission question to encourage authors to revise their methods if they received a score below 4 with no further consequence if they failed to do so.
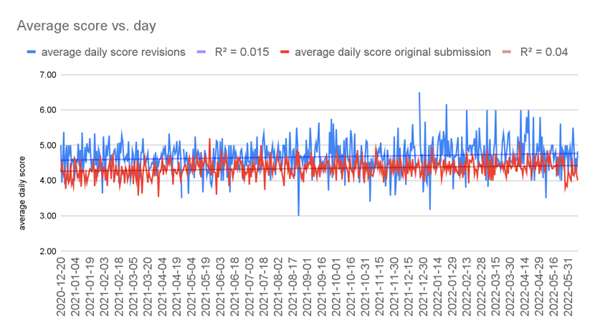
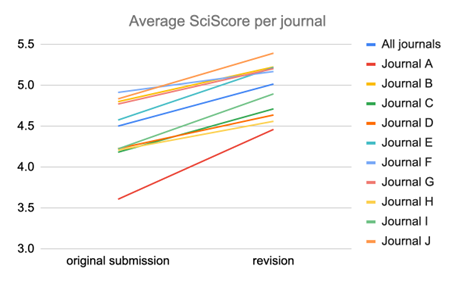
We downloaded the numerical scores for each run of the tool for the publisher and plotted the average monthly scores over time. These scores were stored in the back end of our platform, which was connected to the publisher’s journal submission platform. The tool measured all initial submissions, revisions, and any runs that a user did multiple times to determine if scores were changing over time at a gross level. We found that over time, the average daily scores increased both for original submissions and revisions. We also found that with revision of the manuscript, the average score increased. This suggests that the combination of review and tool use is effective at improving scores.
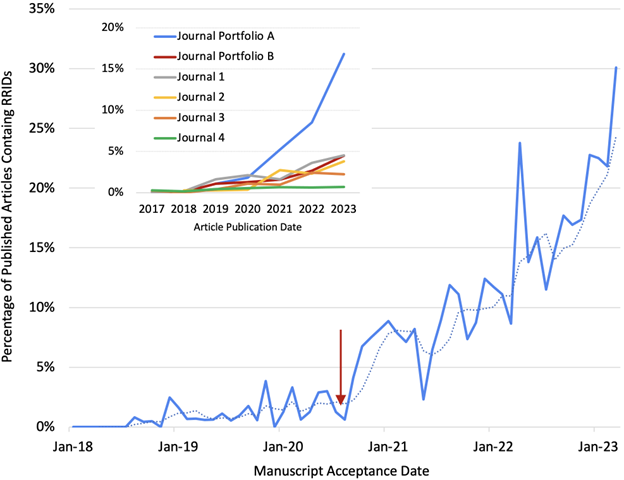
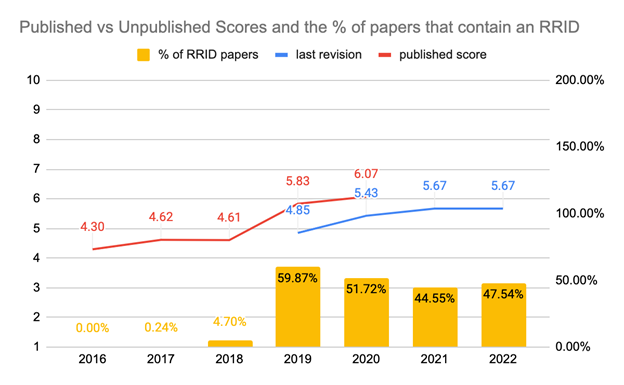
Compliance is hard to measure, except in the case of RRIDs, which can be measured by just searching for the term across journal articles (requires access to the full text). If we assume that all manuscripts have an RRID (which is not exactly true, but it is a reasonable assumption), then the question becomes does SciScore compliance drive additional usage of RRIDs. A request to add RRIDs was added to the instructions to authors of the journal in April 2018, and the SciScore tool was added in June 2020. As Figure 3 shows, the percentage of papers with RRIDs increased substantially immediately after the addition of SciScore and then continued to rise; currently, the rolling average is around 25% (115 per month) of manuscripts. Working with SciScore thus seemed to have accelerated the upward trend. The possibility exists though that some portion of this increase in RRID usage was due to increased uptake of RRIDs in the cancer research field covered by the publisher. To examine this possibility, RRID usage at comparable journals from other publishers was evaluated by searching for the term “RRID” in the subset of articles that also contain the term “cancer”. Results were expressed as a percentage of the total number of published articles containing the term “cancer” (see Figure 2, inset) and showed that the rate of growth in the usage of RRIDs in the “Free for All” publisher (Journal Portfolio A) greatly exceeded that of cancer journals in another publisher with a similar range of impact factors (Journal Portfolio B), 3 individual cancer journals (Journals 1–3) with impact factors similar to the average impact factors of journals in Journal Portfolio A, and an open access mega journal (Journal 4). Results strongly suggest that increased uptake of RRIDs in the cancer community would explain only a small fraction of the increase observed in the “Free for All” publisher.
Use Case 2: “Editor Knows Best”
This publisher had a stringent checklist of rigor items, agreed upon by the publications committee, that was used by editors to verify that all manuscripts meet the guidelines. The usage of the tool happened at each manuscript stage but was primarily intended for the editors who can verify that the checklist items that they are concerned about are present in the manuscript. This process is facilitated by our tool, as opposed to being mediated by our tool because editors communicated with authors about what their manuscripts were missing. The authors were allowed to see the SciScore reports as they were completed. A letter was sent to authors to address the items highlighted in the report. The reviewers were also able to see the report, but they were not directed to look at the content, so it is unclear whether any reviewers saw or acted on the report.
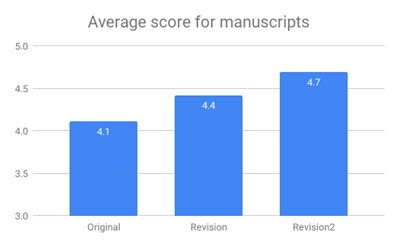
We downloaded the numerical scores from our database and found that there were no differences in the average monthly scores. However, manuscript revisions averaged much higher than original submissions (Figure 4). This suggests that the combination of editorial oversight and tool use was effective in improving scores.
Use Case 3: “Coalition of the Willing”
The publisher implemented SciScore access for all authors who were willing to use it at the revision stages only but did not mandate this for any of the authors at any stage. The number of total runs for this publisher was far smaller, constituting about one-third of the total manuscripts. For this use case, we must note that this publisher started with a single journal, and then brought on several additional journals after 1 year. The data for these additional journals were omitted from this use case because these new journals started at a somewhat lower average score. These 2 additional journals’ (Journal 2 and Journal 3; Figure 5) SciScore averages were similar in value to where Journal 1 started and had only a couple of months of data; therefore, they were not evaluated further.
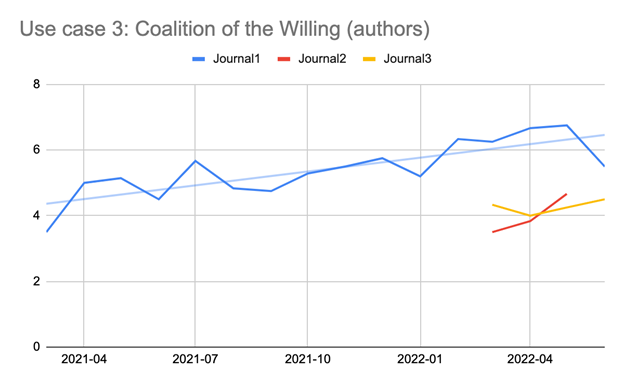
The data for use case 3 consisted entirely of revisions to papers and involved a small portion of the total papers, roughly 30% of all accepted manuscripts to the journal. The data showed that scores grew dramatically in this journal, echoing the gains made in the first use case in the first 3 months of use of the SciScore tool; however, they were sustained during the entire period of use, so far. This also suggests that the overall score of the journal may not improve as much as might be suggested by these rather sanguine changes because the total number of papers counted here is not 100% of the papers published.
Use Case 4: “Tool Verifies Author Behavior”
The publisher implemented a set of stringent guidelines in 201512 that strongly encourages authors to address rigor criteria in their manuscripts. In 2018, these guidelines were refined and updated,13,14 and in 2019, SciScore staff started to use SciScore in a manner similar to use case 2, simply obtaining the report and contacting authors with requested changes. In 2020, the editors started to run the tool and provided the authors with the reports without additional notes or interpretation (Figure 6).
Control
The key question is what happens with journals and manuscripts that do not work with SciScore? To that end, we looked at 190+ manuscripts in journals of 3 different publishers across 12+ months. For all manuscripts, we had both the original submission and revised manuscript. This would help us to assess how far these manuscripts had improved in both presence and absence of SciScore integration.
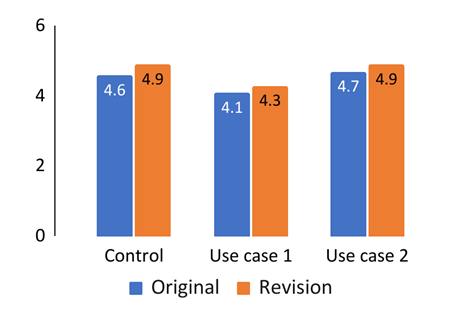
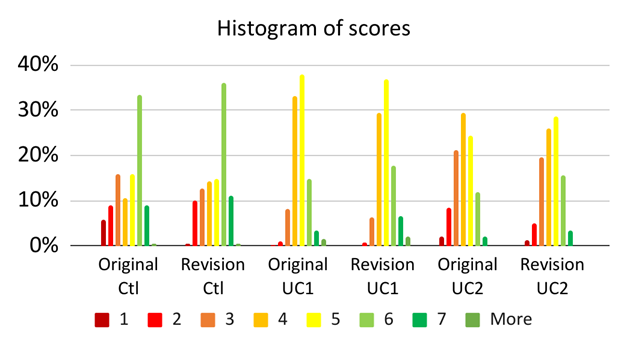
First, we calculated the average SciScores for all 3 cases; control, use case 1, and use case 2 (Figure 7, top). In all cases, the average score increased from original submission to revision, including our control case. We subsequently broke down the scores in a histogram for both original and revised manuscripts (Figure 7, bottom). It is worth noting that our control is rather exceptional in the scores with a high percentage of very high-scoring papers (i.e. “6” scores; based on Menke,11 a “6” is in the 96th percentile of all scores). This can largely be explained by the discipline of the journal (medical); something we observed earlier was that the medical journals largely outperformed preclinical journals, once published.10 In the control journals, we saw “3” scores disappearing from original manuscripts to revisions. Similarly, in use cases 1 and 2, we saw “6” scores increase between original submissions and revisions.
In Figures 2 and 5, we saw an increase over time in daily average scores. We wanted to know whether this increase over time would also be visible for the matched manuscripts. We plotted the scores for the manuscripts over time for both submitted and revised manuscripts and calculated a trendline. What we saw was that, in the control situation (Figure 8, top), without SciScore integration, the trendline remained stable, with an R2 of close to 0. The R2 for original submission even seemed to decrease (i.e., lower scores over time). Looking at the middle panel (Figure 8), for revised manuscripts, we see an R2 of close to 0.3 (i.e., 30% of the variation toward the mean can be explained by working with SciScore). The effect is a bit weaker for original submissions (18%). In use case 2 (Figure 8, bottom) we see a similar effect, and interestingly, a stronger effect for the revisions (20%) vs original submissions (4%).
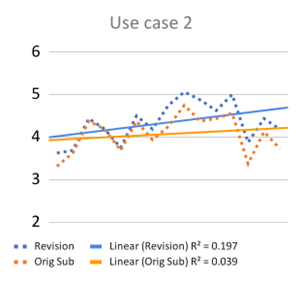
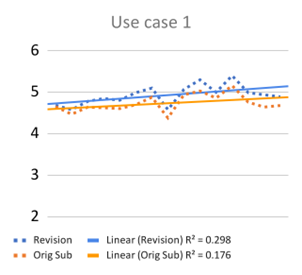 Figure 8. SciScore trends over time for original submission and revisions. For display purposes, we have plotted grouped averages instead of individual dots; however, this did not affect the trendlines.
Discussion
Since the inception of SciScore in 2020 and its integration in major journal submission platforms later that year, various use cases have been initiated at a number of society publishers, as outlined above. Whereas some publishers let authors use the tool in an unlimited fashion at various stages of the peer-review process, others opted for more limited and directed use of the tool. Up until now, it was largely unknown whether working with SciScore had any effect on the rigor and reproducibility adherence of journals, let alone which of the use cases would provide the best result. With the data laid out in this paper, we can draw a couple of conclusions.
Limitations of the Study
In this comparison of the 4 use cases with control, we were limited by a number of factors. Although we had 4 use cases, only 2 of them had such an integration that we could compare scores of identical papers at submission and revision stages. The other 2 use cases (3 and 4) used a different setup where the tool was used primarily by editors or by willing authors at revision. Therefore, there was no way to compare the results of these 2 use cases directly with use cases 1 and 2. We also cannot know at the current moment what the final published manuscripts will score, as many of these are embargoed for roughly 6 months, making a direct comparison difficult. We have sufficient data for this only in use case 4, but not yet for the others. Although the journals used in our comparison (Figures 6 and 7) are all life science and/or medicine, they are also different, especially in that the focus of the control is medicine, and the focus of other journal use cases is preclinical research. We know that medical journals tend to score higher than preclinical journals once the papers are published.10 The histogram of scores illustrates this point, with a high percentage of “6” scores for the control vs the others.
In use case 1, we observed an increased score between original submission and revision across all analyzed manuscripts. In this use case, the tool is primarily author-centric. We could also see a slight increase in the daily average score, which might be explained by authors’ increased awareness of rigor and reproducibility guidelines. These results are consistent for both the average daily scores as well as matched manuscripts of original submissions and revisions.
In use case 2, the tool is more editor- and reviewer-centric because it helps them in their feedback to authors. Authors do not encounter any SciScore reports nor information on the publisher website, which may explain why average scores for original submissions remain relatively stable. If we look at individual journals, we notice that all journal average scores increased to some degree. The variety may be explained by the variety in editorial boards—some editors may use the tool more than others.
In use case 3, we see an interesting diversion from the previous 2 cases. In this use case, SciScore was only used by authors (as in use case 1), but it is used in the revision stage for a small percentage of manuscripts. Although the average scores of all tested manuscripts increased rapidly, it is unclear what the overall effect is for the journal because most manuscripts were not tested in review. It remains to be seen how these papers will affect the journal’s 2021 RTI (Rigor and Transparency Index).10 However, the 4% month over month increase in the average score is encouraging because it suggests that the editors are becoming increasingly aware of rigor and reproducibility guidelines.
From the last use case, we can learn that implementing rigor guidelines alone does not necessarily increase the journal RTI sufficiently, but a combination of SciScore and rigor guidelines seemed to improve scores substantially. The biggest jump in RTI of over 1 point score increase and a more than 50% jump in the percentage of papers with RRIDs occurred once SciScore staff started to run reports, contacting authors with requested changes.
Although the data for the 4 use cases look promising, proper control was needed to assess how far the results presented were an effect of the entire peer-review process or the integration with SciScore. We have seen in our earlier work10 (Figures 2 and 3) that journals can increase their RTI if they change their approach, for example, in 2013–2014, when Nature made a significant push with authors to address rigor criteria, or in 2016 when Cell and eLife introduced STAR (Structured, Transparent, Accessible Reporting) methods formatting and implementation of RRIDs in their respective journals, contributing to a noticeable improvement in antibody identifiability for the entire biomedical literature.
In our control dataset, we compared scores of original submissions and revisions of the same papers from a publisher not working with SciScore. This showed that the average SciScore for those papers increased between original submission and revision, in a similar manner as for those journals working with SciScore. This suggests that peer review and editorial oversight in and of itself do improve rigor and reproducibility adherence in journals. However, in contrast to control, the scores increased over time, suggesting that authors and editorial teams became more aware of rigor and reproducibility issues and highlighted those in their comments to the authors. As a consequence, our data suggest that journals working with SciScore increase their average score over time and increase their adherence to rigor and reproducibility guidelines, whereas journals not working with SciScore tend to remain more stable over time.
The other benefit of working with SciScore may simply be that the tool makes it easier for editors to strictly enforce the standards that they are intending to enforce. Unlike humans, SciScore does not ever tire of pointing out that blinding is also missing in a particular manuscript, therefore making it easier for editors to highlight commonly omitted items. Neither does it suffer from error or inattention blindness or task monotony.
Conclusion: Dialing in Transparency
Although changes in journals tend to be gradual, Figure 5 shows that they can be relatively abrupt, with over 50% shift year over year in compliance with the RRID standard. While training staff and maintaining high standards for publication, SciScore can enable journals to dial in reproducibility simply by requesting that authors achieve a certain score. This feature of the tool was used only by the journals represented in use case 1, where authors are asked to score higher than a 4/10; however, this number can be moved by asking authors to achieve a different score. We anticipate that as journal editors get to know and trust the tool, they will start to use the score to improve transparency compliance by requesting it and ensuring that the score obtained is sufficient.
Disclosures
A.B. and I.B.O. have an equity interest in SciCrunch Inc, the company behind the development of SciScore. D.A. works for the American Association for Cancer Research, one of the clients of SciCrunch Inc. The terms of this arrangement were reviewed and approved by the University of California, San Diego, California, in accordance with its conflicts of interest policies. M.R. and I.B.O. serve as independent contractors for SciCrunch.
Acknowledgements
The authors would like to thank the anonymous publishers who gratefully agreed to allow use of their data in this study. We also thank Adam Day, Sage Publishing, for helpful conversations and insights into this work. SciScore was funded by the US National Institutes of Health (OD024432, DA039832, DK097771, MH119094, and HHSN276201700124P). This project has been made possible in part by grant 2022-250218 from the Chan Zuckerberg Initiative DAF, an advised fund of the Silicon Valley Community Foundation. The funders had no role in study design, data collection and analysis, decision to publish, or preparation of the manuscripts.
References and Links
- Landis SC, Amara SG, Asadullah K, et al. A call for transparent reporting to optimize the predictive value of preclinical research. Nature. 2012;490:187–191. https://doi.org/10.1038/nature11556
- Macleod M, Collings AM, Graf C, Kiermer V, Mellor D, Swaminathan S, Sweet D, Vinson V. The MDAR (Materials Design Analysis Reporting) Framework for transparent reporting in the life sciences. Proc Natl Acad Sci U S A. 2021;118. https://doi.org/10.1073/pnas.2103238118
- Macleod MR, O’Collins T, Horky LL, Howells DW, Donnan GA. Systematic review and metaanalysis of the efficacy of FK506 in experimental stroke. J Cereb Blood Flow Metab. 2005;25:713–721. https://doi.org/10.1038/sj.jcbfm.9600064
- https://www.rrids.org/
- Bandrowski AE, Martone ME. RRIDs: simple step toward improving reproducibility through rigor and transparency of experimental methods. Neuron. 2016;90:434–436. https://doi.org/10.1016/j.neuron.2016.04.030
- Curtis MJ, Ashton JC, Moon LDF, Ahluwalia A. Clarification of the basis for the selection of requirements for publication in the British Journal of Pharmacology: editorial. Br J Pharmacol. 2018;175:3633–3635. https://doi.org/10.1111/bph.14443
- Tedersoo L, Küngas R, Oras E, Köster K, Eenmaa H, Leijen Ä, Pedaste M, Raju M, Astapova A, Lukner H, et al. Data sharing practices and data availability upon request differ across scientific disciplines. Sci Data. 2021;8:192. https://doi.org/10.1038/s41597-021-00981-0
- Nosek BA, Ebersole CR, DeHaven AC, Mellor DT. The preregistration revolution. Proc Natl Acad Sci U S A. 2018;115:2600–2606. https://doi.org/10.1073/pnas.1708274114
- Bandrowski A. (2022). A decade of GigaScience: What can be learned from half a million RRIDs in the scientific literature? GigaScience. 2022;11:giac058. https://doi.org/10.1093/gigascience/giac058
- Menke J, Roelandse M, Ozyurt B, Martone M, Bandrowski A. The rigor and transparency index quality metric for assessing biological and medical science methods. iScience. 2020;23:101698. https://doi.org/10.1016/j.isci.2020.101698
- Menke J, Eckmann P, Ozyurt IB, Roelandse M, Anderson N, Grethe J, Gamst A, Bandrowski A. Establishing institutional scores with the rigor and Transparency Index: large-scale analysis of scientific reporting quality. J Med Intern Res. 2022;24:e37324. https://doi.org/10.2196/37324
- Curtis MJ, Bond RA, Spina D, Ahluwalia A, Alexander SP, Giembycz MA, Gilchrist A, Hoyer D, Insel PA, Izzo AA, et al. Experimental design and analysis and their reporting: new guidance for publication in BJP. Br J Pharmacol. 2018;172:3461–3471. https://doi.org/10.1111/bph.12856
- Docherty JR, George CH, Giembycz MA, Hoyer D, Insel PA, Izzo AA, Ji Y, MacEwan DJ, Sobey CG, Stanford SC, et al. Experimental design and analysis and their reporting II: updated and simplified guidance for authors and peer reviewers. Br J Pharmacol. 2015;175:987–993. https://doi.org/10.1111/bph.14153
- Teytelman L, Stoliartchouk A, Kindler L, Hurwitz BL. Protocols.io: virtual communities for protocol development and discussion. PLoS Biol. 2016;14:e1002538. https://doi.org/10.1371/journal.pbio.1002538
Martijn Roelandse (https://orcid.org/0000-0001-5596-8084), martijnroelandse.dev, Ouderkerk aan de Amstel, The Netherlands; I. Burak Ozyurt (https://orcid.org/0000-0003-3944-1893), SciCrunch Inc., San Diego, CA, and Department of Neuroscience, University of California, San Diego, La Jolla, CA; Daniel Evanko (https://orcid.org/0000-0002-8097-8601), American Association for Cancer Research, Philadelphia, PA; Anita Bandrowski (https://orcid.org/0000-0002-5497-0243), Department of Neuroscience, University of California, San Diego, La Jolla, CA.
Opinions expressed are those of the authors and do not necessarily reflect the opinions or policies of the Council of Science Editors or the Editorial Board of Science Editor.